
How to Choose a Velocity Sensor in 2026?

Choosing a Velocity Sensor in 2026 is less about picking the newest model and more about matching the instrument to the motion. A sensor that performs well on a test bench may give misleading readings on a hot pump casing or a loosely mounted motor. Start with the machine, the frequency range, and the signal you need—not the product headline.

Lord Kelvin, a renowned authority on measurement, captured a principle that still guides sensor selection: “When you can measure what you are speaking about, and express it in numbers, you know something about it.” His words are not specific to velocity sensors, but they underline why clear measurement requirements matter. Define whether you need overall vibration velocity, frequency-specific analysis, or continuous monitoring. Check mounting method, operating temperature, output type, and compatibility with your data-acquisition system. Small details count.

Then compare sensitivity, frequency response, ruggedness, calibration support, and lifecycle cost. A specification sheet cannot tell you everything. Ask how the sensor behaves on your actual machine, under real mounting conditions. Test it. Keep the setup notes; they are easy to overlook, and that can weaken later comparisons. This guide will help you assess these factors and choose a Velocity Sensor with evidence rather than guesswork. There may not be one perfect choice. The right one is the sensor that produces dependable, useful readings in your application.
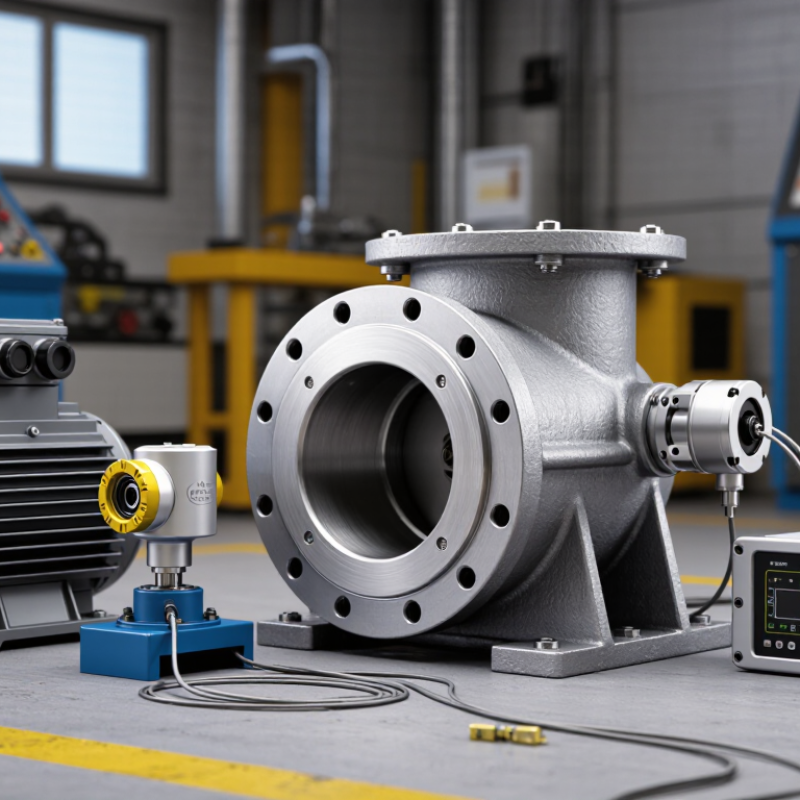
How to Choose a Velocity Sensor in 2026?

Define the Target: ISO 20816 Rates Machine Vibration in RMS mm/s

When choosing a velocity sensor, define the measurement target before comparing specifications. ISO 20816 assesses machine vibration using RMS velocity, commonly expressed in mm/s, within the standard’s applicable scope. RMS reflects vibration energy over a measurement interval, not the highest instantaneous peak. A machine can therefore show a moderate RMS reading while still producing brief impacts worth investigating.

The correct assessment depends on machine type, measurement location, direction, and operating condition. Limits are not universal. Check the relevant ISO 20816 part and measure at consistent points, such as bearing housings, while the machine runs steadily. That sounds simple, but changing load or sensor mounting can shift the result.

Match the sensor’s frequency response and output to the vibration range and data system you need. Some instruments measure velocity directly; others derive it from acceleration, which can add low-frequency noise or setup errors. Secure mounting matters: a loose magnetic base on a rough, painted housing may distort readings. Record speed, load, location, and mounting method with each measurement. I have seen tidy numbers become hard to compare when those details were missing. RMS mm/s is useful, but only when the measurement conditions are repeatable.

Match the Bandwidth: ISO 2954 Covers 10 Hz to 1 kHz

Choosing a velocity sensor starts with the frequencies your machine actually produces.

ISO 2954:2012 specifies a 10 Hz to 1 kHz frequency range for instruments measuring vibration severity. That equals 600 to 60,000 cycles per minute.

Treat it as a measurement-chain reference, not proof that every sensor performs equally across the band.

Check the sensor’s frequency response, mounting method, and signal conditioner together. A 10 Hz lower cutoff may weaken readings near that boundary; components below it may be missed.

Small detail. A loose stud or flexible mounting surface can also distort high-frequency readings. Match the sensor and mounting arrangement to the test, then confirm the complete setup against the standard’s band.

The awkward part: a sensor’s headline range can hide uneven response at its edges.

For machine-condition work, compare the chosen band with the frequencies you need to assess, and consult ISO 20816-1:2016 for broader guidance on evaluating machine vibration.

Record the sensor, mount, and conditioner settings so later readings remain comparable. I would not treat bandwidth as the whole decision; it is a clear starting point, but real installations can still surprise you.

Choose the Sensor Principle: At 1 Hz, 1 m/s² Equals 159.2 mm/s

At 1 Hz, a sinusoidal acceleration of 1 m/s² corresponds to a velocity amplitude of about 159.2 mm/s. The relationship is v = a ÷ (2πf). That frequency matters. The same acceleration at 10 Hz represents only about 15.9 mm/s. This conversion helps compare sensor readings, but only when the motion is sinusoidal and peak values are compared consistently.

An accelerometer measures acceleration directly, while a velocity sensor measures motion speed. Acceleration sensors can cover broad frequency ranges and are useful when you need to inspect higher-frequency vibration. Velocity sensors can be practical for assessing machine vibration in a defined, lower-frequency band. Check the sensor’s usable frequency range, noise floor, mounting method, and output before choosing. A sensor that looks suitable on paper may struggle near its low-frequency limit.

For a real check, note the machine’s operating speed and the vibration frequency, then compare readings using matching units and amplitude conventions. RMS and peak values are not interchangeable. Small detail, big difference. If you integrate acceleration to estimate velocity, low-frequency noise and signal processing can distort the result. I still find that easy to overlook. Measure at the same mounting point when comparing machines, and verify the setup against a known reference when accuracy matters.

How to Choose a Velocity Sensor in 2026? - Choose the Sensor Principle: At 1 Hz, 1 m/s² Equals 159.2 mm/s

Choose a sensor based on the frequency range, required output, mounting conditions, and the complete measurement chain. For sinusoidal vibration, acceleration and velocity are related by v = a / (2πf); use the same peak or RMS convention for both quantities. At 1 Hz: 1 m/s² ÷ (2π × 1 Hz) = 0.1592 m/s = 159.2 mm/s.

Sensor principle What it measures / outputs Low-frequency behavior Suitability at 1 Hz Best fit and key considerations
Capacitive MEMS accelerometer Measures acceleration; many designs provide a DC-capable output. Can measure down to static acceleration, while usable bandwidth and noise depend on the specific device and signal-conditioning system. Often a good choice when 1 Hz matters. Convert acceleration to velocity by integration; low-frequency noise and offset can accumulate as drift. Useful for low-frequency motion and applications that also need tilt or quasi-static measurements. Check noise density, bandwidth, and integration method.
Piezoelectric accelerometer Measures dynamic acceleration; the signal is commonly converted or conditioned by a charge amplifier or integrated electronics. Lower usable frequency is set by the sensor and its electronics. Some measurement chains support sub-hertz measurements; others have a higher low-frequency cutoff. Suitable only when the complete sensor-and-conditioning chain has a calibrated response at 1 Hz and sufficiently low noise. Well suited to many dynamic vibration measurements and wider frequency ranges. Verify the specified lower frequency limit rather than assuming all piezoelectric systems perform alike.
Electrodynamic geophone / velocity pickup Produces an electrical output related to vibration velocity above its mechanical resonance. Common geophone natural frequencies include 4.5, 10, and 14 Hz. Below resonance, response changes significantly unless corrected. Usually not a straightforward choice at 1 Hz for a standard geophone. Use only with a suitable low-natural-frequency design or validated response correction. Useful for ground-motion and vibration measurements in its designed band. Check natural frequency, damping, and calibration across the intended range.
Laser Doppler vibrometer Measures surface velocity optically without attaching a sensor to the test object. Usable frequency range is system-dependent and can be configured for low-frequency measurements; line of sight and signal quality matter. Can measure 1 Hz when the instrument configuration, target, and acquisition settings support that frequency. Useful for delicate, small, hot, or inaccessible objects. Requires an unobstructed optical path; surface reflectivity and target motion affect measurement quality.

Selection note: Frequency limits and performance vary by model and measurement setup. Confirm the calibrated operating range, noise, mounting method, and signal-processing requirements for the complete system.

Size the Range and Output: Compare Full Scale, Sensitivity, and 4–20 mA

Start with the highest credible vibration velocity, not just the machine’s normal reading. A pump that usually runs near 6 mm/s may spike during startup or under changing loads. Choosing a 0–10 mm/s range could clip those events. A 0–25 mm/s range leaves room, but gives less detail across the usual operating zone. That trade-off matters.

Check sensitivity against the measurement input. A sensor rated at 100 mV per mm/s produces 600 mV at 6 mm/s, before considering signal conditioning. Confirm that the input can accept the expected signal without clipping or burying small changes in noise. Keep units and RMS or peak conventions consistent. Easy to overlook.

For a 4–20 mA output, verify what vibration values map to 4 mA and 20 mA. If 0–20 mm/s maps across that span, 12 mA represents 10 mm/s. Check the receiving instrument’s scaling, loop supply, and total resistance; otherwise, the displayed value may be wrong even when the sensor is suitable. The 4 mA live zero can help reveal a broken loop, but it does not diagnose every wiring fault. I would also leave margin for real operating peaks. That can feel conservative, and sometimes it is.

Check Mounting and Machine Class Against the Relevant ISO 20816 Part

When choosing a velocity sensor, start with the machine, not the catalogue. ISO 20816 is a series, and the applicable part depends on machine type and operating conditions. Check whether the machine is a pump, fan, compressor, or another class, then confirm the relevant part and edition. The standard helps define evaluation zones and measurement locations; it does not prescribe one sensor for every machine. Speed, support stiffness, and operating state matter. A rigidly supported pump may behave differently from a flexible machine on a steel frame. Small details matter.

Mounting affects what the sensor can measure. A stud mount on a clean, flat surface usually provides a firm mechanical connection. If drilling is impractical, an adhesive pad or magnetic base may suit temporary checks, but can limit high-frequency response. Confirm the sensor’s frequency range, measurement direction, mass, and output compatibility with the data collector. Place it close to the bearing housing, on a sound surface, and keep the position consistent between readings. Avoid paint, loose covers, and curved surfaces where possible. Field conditions are rarely perfect; record the mounting method and location, because a small change can make trend comparisons less reliable.

Optimized by Optimole